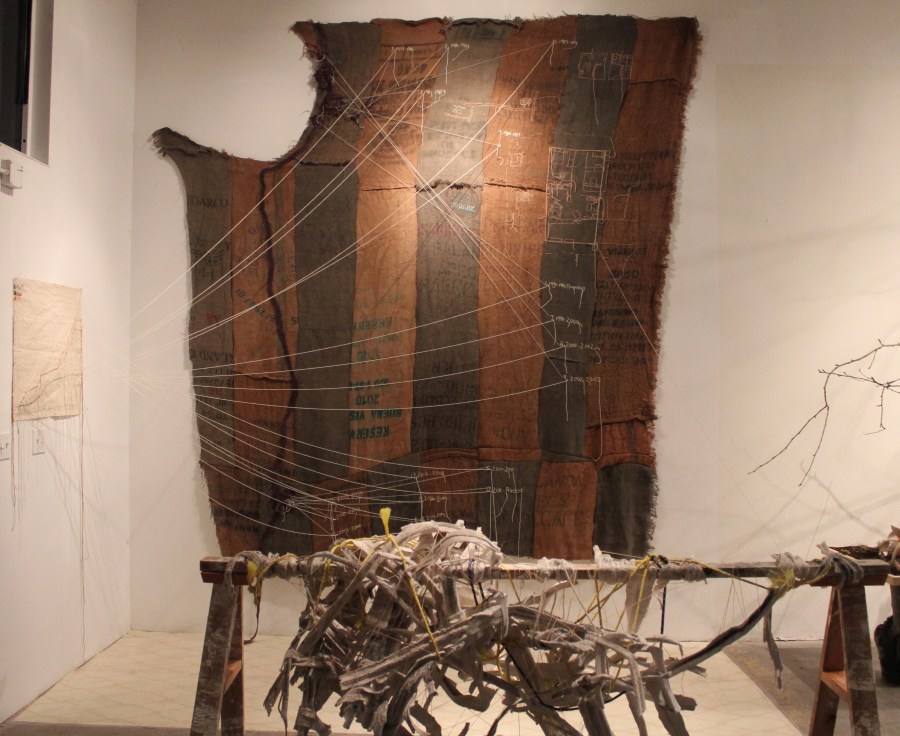


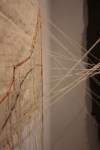

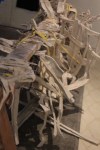
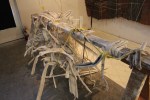
Hydrastone, 2 x 4s, burlap, canvas, thread, wall paper, yarn, 18″ x 12″ x 15″. 2012.
These are images from my corner of the mid-year open house. It was the end of the term show – an installation.
This work is related to Home: (an excavation) 1984 – 1989, which was the thesis project for my graduate degree. This work was the physical working out of data I had been gathering about my own personal history; the timeline graph depicting every house I lived in and which parent I lived with; the map showing where we lived, a rough blueprint/outline of certain homes and the dates I lived in each; and lastly the emotional graph acting as graph for the emotional turmoil connected to one specific home and period of time.
